Dashboard & Metrics
Dashboard & Metrics
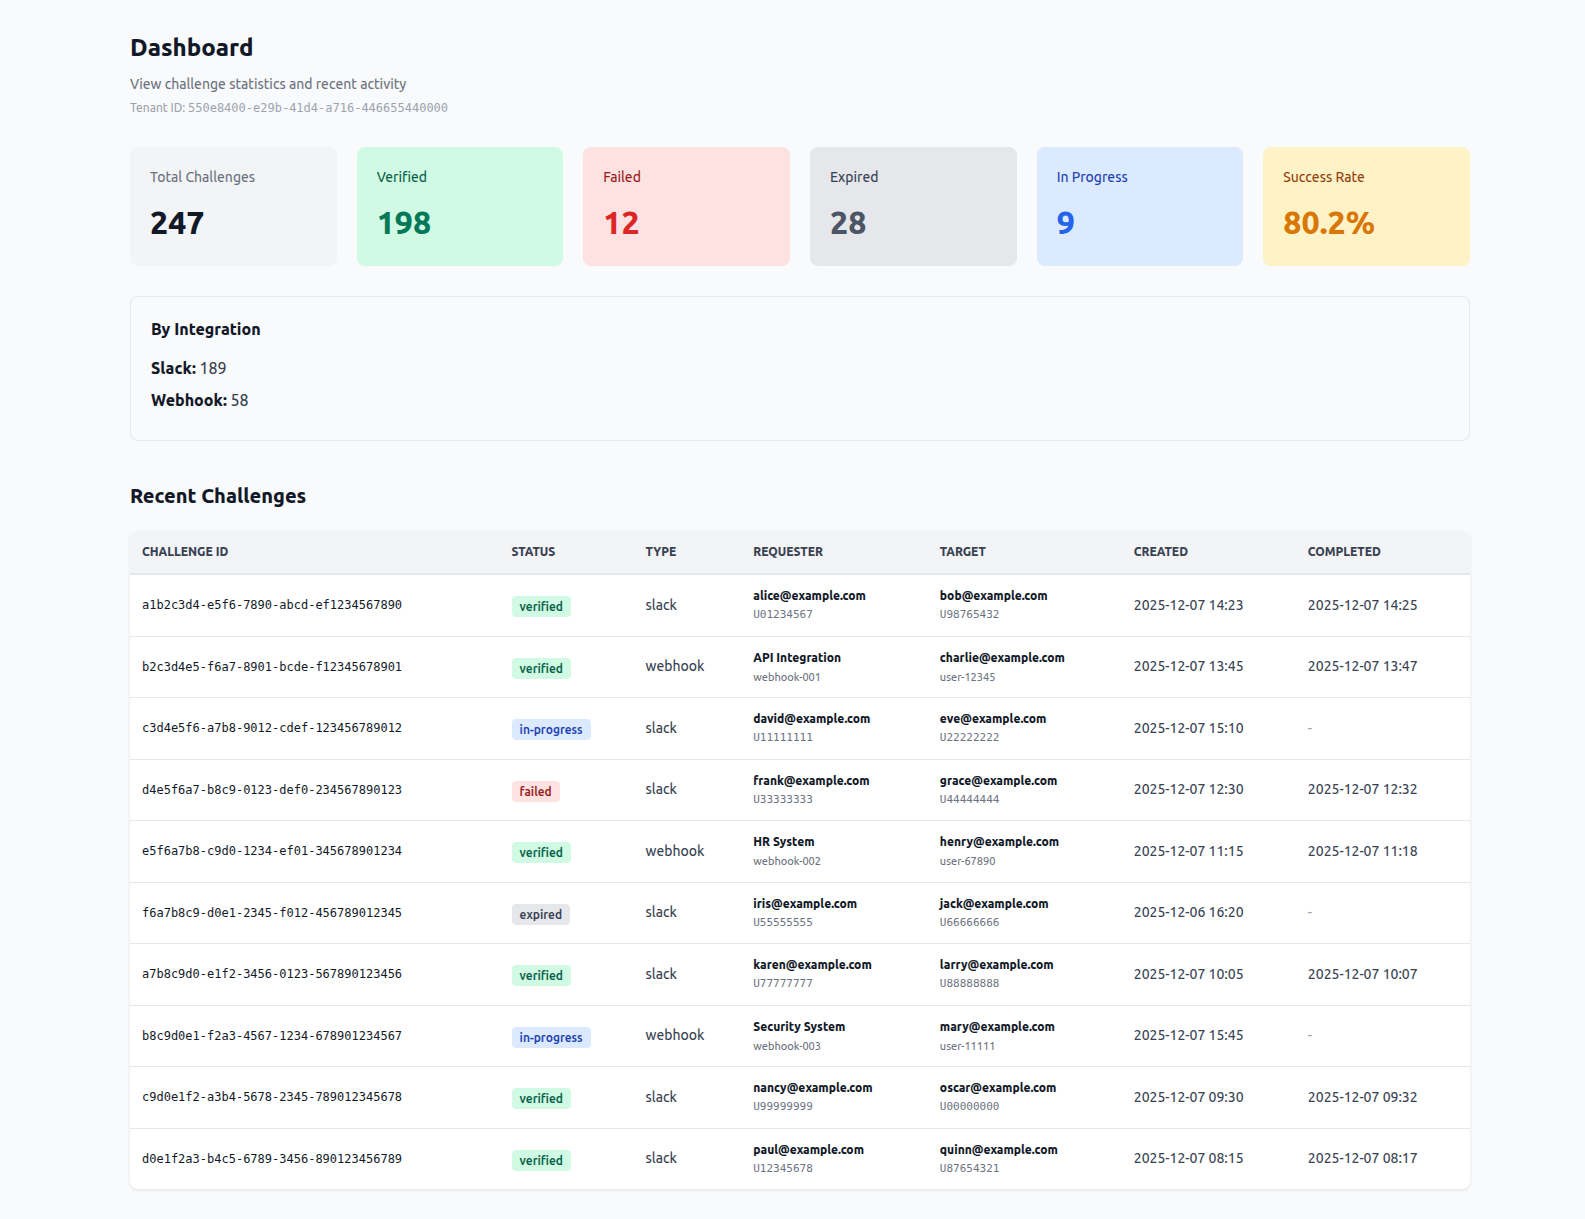
The Challenge dashboard provides real-time visibility into identity verification challenges, session revocation requests, device containment actions, and a unified activity history.
Overview
The Challenge dashboard displays:
- Challenge statistics: Breakdown by status (Verified, Failed, Expired, In Progress) and success rate
- Session revocation statistics: Total, completed, failed, and success rate for revocation requests
- Device containment statistics: Total, completed, failed, and success rate for containment requests
- Activity feed: Combined list of challenges, session revocations, and device containment with filters
Accessing the Dashboard
- Log in to the Challenge admin console at challenge.veraproof.io
- The dashboard is the default page after login
- You can also navigate to Dashboard from the main navigation menu
Note: For usage and billing metrics (challenge counts, tier limits, overage charges, subscription status), see the Billing & Subscription Management page.
Challenge Statistics
The dashboard displays aggregate statistics about your challenges:
Total Challenges by Status
The dashboard shows a breakdown of all challenges by their current status:
- Verified: Number of challenges that completed successfully
- Failed: Number of challenges that failed (authentication failed or user denied)
- Expired: Number of challenges that expired before completion (see Challenge expiry for the configured time window)
- In Progress: Number of challenges currently being verified
- Initiated: Number of challenges created but not yet started
These statistics help you understand:
- Success rate of your challenges
- Common failure points
- Challenge completion patterns
Session Revocation Statistics
When session revocation is enabled, the dashboard shows a Session revocations section:
- Total Revocations: All session revocation requests for your tenant
- Completed: Requests where every targeted connector succeeded
- Failed: Requests where at least one connector returned a failure
- Success Rate: Percentage of completed requests
Click a statistic card to filter the activity feed to revocations with that status.
Device Containment Statistics
When device containment is enabled, the dashboard shows a Device containment section:
- Total Containments: All device containment requests for your tenant
- Completed: Requests where every targeted connector succeeded
- Failed: Requests where at least one connector returned a failure
- Success Rate: Percentage of completed requests
Click a statistic card to filter the activity feed to containments with that status.
Activity Feed
The Activity section lists challenges, session revocations, and device containment requests in one table (newest first). Use the pills above the table:
- All events — Challenges, session revocations, and device containment together
- Challenges only — Filter by challenge status using the challenge statistic cards
- Session revocations only — Filter by revocation status using the revocation statistic cards
- Device containment only — Filter by containment status using the containment statistic cards
Session revocation rows
Session revocation events show:
| Column | Description |
|---|---|
| Event | Session revocation |
| ID | Revocation request_id |
| Status | completed, failed, or in-progress states |
| Channel | Admin UI (Responder), MCP, or Webhook |
| Subject | Target username (email or UPN) |
| Reason / detail | Reason text and per-connector outcome summary |
| Initiator | Admin user ID, MCP client, or webhook source |
| Created / Completed | Timestamps |
Device containment rows
Device containment events show:
| Column | Description |
|---|---|
| Event | Device containment |
| ID | Containment request_id |
| Status | completed, failed, or in-progress states; dry-run requests show (dry run) |
| Channel | Admin UI (Responder), MCP, or Webhook |
| Subject | Lookup value (email, hostname, or serial) and lookup type |
| Reason / detail | Action (lock_device, network_contain, release_containment), optional reason text, and per-connector outcome summary (for example, jamf: locked (1 device)) |
| Initiator | Admin user ID, MCP client, or webhook source |
| Created / Completed | Timestamps |
Use this feed to audit containment actions and to confirm Responder or automation tests succeeded.
Challenge Activity (detail)
Challenge rows in the activity feed include:
Challenge List Columns
- Challenge ID: Unique identifier for the challenge
- Target User: Email address or identifier of the user being challenged
- Status: Current challenge status (see Challenge Statuses below)
- Created: Timestamp when the challenge was created
- Completed: Timestamp when the challenge was completed (if applicable)
- Method: Authentication method used (SAML, OIDC, or Slack)
- Requester: Who or what system created the challenge
- Justification: Optional responder context captured from Slack challenge actions
Challenge Statuses
Challenges can have the following statuses:
- Initiated: Challenge created but not started by the user
- In Progress: User has started the verification process
- Verified: Challenge completed successfully - identity verified
- Failed: Challenge failed (authentication failed or user denied)
- Expired: Challenge expired before the user completed verification within the configured expiry window
Filtering challenges
Click challenge statistic cards (Total Challenges, Verified, Failed, and so on) while viewing Challenges only or All events to filter the activity table by challenge status. The table columns mirror the feed: event type, ID, status, channel (requester type), subject, reason/context, justification, initiator, and timestamps.
Navigation
Use the main menu to open Integrations, Responder, Billing, and other admin pages. The dashboard itself focuses on metrics and the activity table. All tenant roles (Viewer, Analyst, Admin, Owner) can access the dashboard; configuration pages require Admin or Owner unless noted in User Management.
Best Practices
- Review failed events: Investigate failed challenges, revocations, and containments separately; connector failures often indicate credentials, scopes, or lookup format issues
- Monitor all success rates: Challenge, revocation, and containment success rates answer different operational questions
- Filter during incidents: Use Session revocations only or Device containment only while validating a new connector or SOAR playbook
- Correlate with Responder tests: After a test revocation or containment action, confirm a completed row with channel Admin UI before enabling automation
- Watch billing usage: Completed revocations and device containment requests count toward metered usage together with challenges; dry-run containments and failed requests are not billed — see Billing & Subscription Management
Troubleshooting
Statistics Not Updating
- Refresh the dashboard page
- Check that challenges are being created successfully
- Statistics update in real-time as challenges are created and completed
Activity List Empty
- Check event-kind filters (All events, Challenges only, Session revocations only, Device containment only)
- Statistic card filters may hide rows; click Total cards to reset status filters
- Paginate with Next if older events exist on later pages
Statistics Seem Incorrect
- Statistics are calculated from all challenges, revocation requests, and device containment requests in your tenant
- Refresh the page to see the latest counts
- Revocation and containment success rates use completed vs total requests for each event type, independent of challenge success rate
Support
For issues or questions about the dashboard or metrics, contact support@veraproof.io.
For related guides, see:
- Device Containment - Configure and trigger MDM lock and EDR isolation
- Session Revocation - Configure and trigger revocations
- Responder - Manual challenges, session revocation, and device containment
- Challenge expiry - Default and tenant-level verification time limits
- Webhook Integration - Create challenges programmatically
- Slack Integration - Use Slack slash commands
- Billing & Subscription Management - Usage events include challenges, revocations, and device containment